Non-downward propagating SSWs?
Major stratospheric sudden warming events (SSWs) attract widespread attention because they are now known to have significant impacts on the tropospheric circulation (e.g. Baldwin and Dunkerton 2001, hereafter BD01). Anomalies in the stratospheric circulation (often expressed as the Northern Annual Mode (NAM) index, or polar cap geopotential height anomalies) propagate downwards through the stratosphere into the troposphere, rather like “dripping paint” (such as BD01 Fig. 2). A major SSW is associated with the development of a negative NAM in the stratosphere; the “typical” response is the development of a negative NAM (or the associated NAO/AO) in the troposphere ~10-14 days after the central date of the SSW (when the 10 hPa 60N zonal-mean zonal wind becomes easterly) which can persist for several months.
However, not all SSWs were created equal – and some SSWs do not strongly couple to the tropospheric circulation. A recent study by Karphechko et al. (2017) classified major SSWs as “downward propagating” (dSSW) or otherwise (nSSW) based on the 1000 hPa NAM index following the event, and found 43% were nSSW – i.e., not followed by a strong and persistently negative surface NAM. This is not a small fraction of SSWs, and the atmospheric evolution following the two types was found to be significantly different.
Our perception of SSWs in recent years has been highly influenced by a relatively unusual clustering of vortex-split, downward-propagating events (Jan 2009, Feb 2010, Jan 2013 and Feb 2018) which all had similar tropospheric impacts (all 4 of those events were followed by an outbreak of snow/cold in the UK, for example). The most recent nSSW occurred in Feb 2008. Thus, the announcement of a major SSW – particularly on social media – has become synonymous with a specific weather pattern.
In the nSSW cases considered by Karpechko et al., the composite (their Fig. 1c) actually shows intermittently positive NAM in the troposphere following the SSW – with the sign of the NAM opposing between the lower stratosphere and the troposphere for ~40 days following the central date. This is very different to the picture of dripping -NAM anomalies into the troposphere that BD01 made famous (which is consistent with Karpechko et al.’s dSSW).
Composites of all major SSWs are influenced by the higher frequency of dSSW and the stronger circulation anomalies induced, but this work suggests we need to be wary of these stratospheric events which don’t strongly influence what happens beneath. However, forecast models often struggle to predict the downward propagation – so forecasting these events is troublesome. It also presents a communication problem, which current forecasts (see below!) suggest we may be about to run into: a major SSW could mean a significant reversal of the normal tropospheric circulation (with the potential for “Beast from the East”-type events in the UK), or it could mean very little (e.g. January 2002 following the non-downward propagating Dec 2001 SSW). Predicting these differences, and understanding the mechanisms involved, is an area of active research – and something I hope to address in my PhD work.
Do current forecasts suggest nSSW or dSSW?
As I write this, we’re in a tentative stage – the main stratospheric heat flux event has occurred, and the 60N zonal-mean zonal wind has reversed to easterlies in the upper stratosphere. However, at 10 hPa we’re still decelerating – with the event expected to become ‘major’ around Jan 1 (Fig. 1 & 2) if current forecasts are correct (inter-model agreement has substantially increased now the upper-stratospheric reversal is in the observations). The event looks very likely to be first driven by a wave-1 displacement of the vortex towards Eurasia, with an increasing likelihoodo of a vortex split (wave-2) to then occur, with the dominant daughetr vortex over Eurasia and a smaller vortex over N America (interestingly, this is opposite to what happened in Feb 2018). However, agreement on the split evolution remains lower than the displacement.


So, predicting the tropospheric impacts is a challenge when the stratospheric forecasts don’t agree! The spread in the GEFS forecasts beyond 10 days is very large – with some members showing a quick return to stratospheric westerlies whilst others flirt with record-strong easterlies. There’s even some indication of bifurcation in the ensemble at longer ranges (perhaps relating to whether or not a split occurs), which may render the ensemble mean of less use.
Despite the uncertainty, one aspect that has been relatively persistent is the absence of a signal for downward propagation in the deterministic GFS (Fig. 3) and the longer-range models such as CFSv2 (Fig. 4). Comparing Fig. 3 here with the nSSW composite in the Karpechko paper is striking – there are many similarities, including the weak -NAM before the main event and the ~day 10 tropospheric +NAM development. On its own, this screams nSSW – but of course is just a single deterministic forecast from one model.

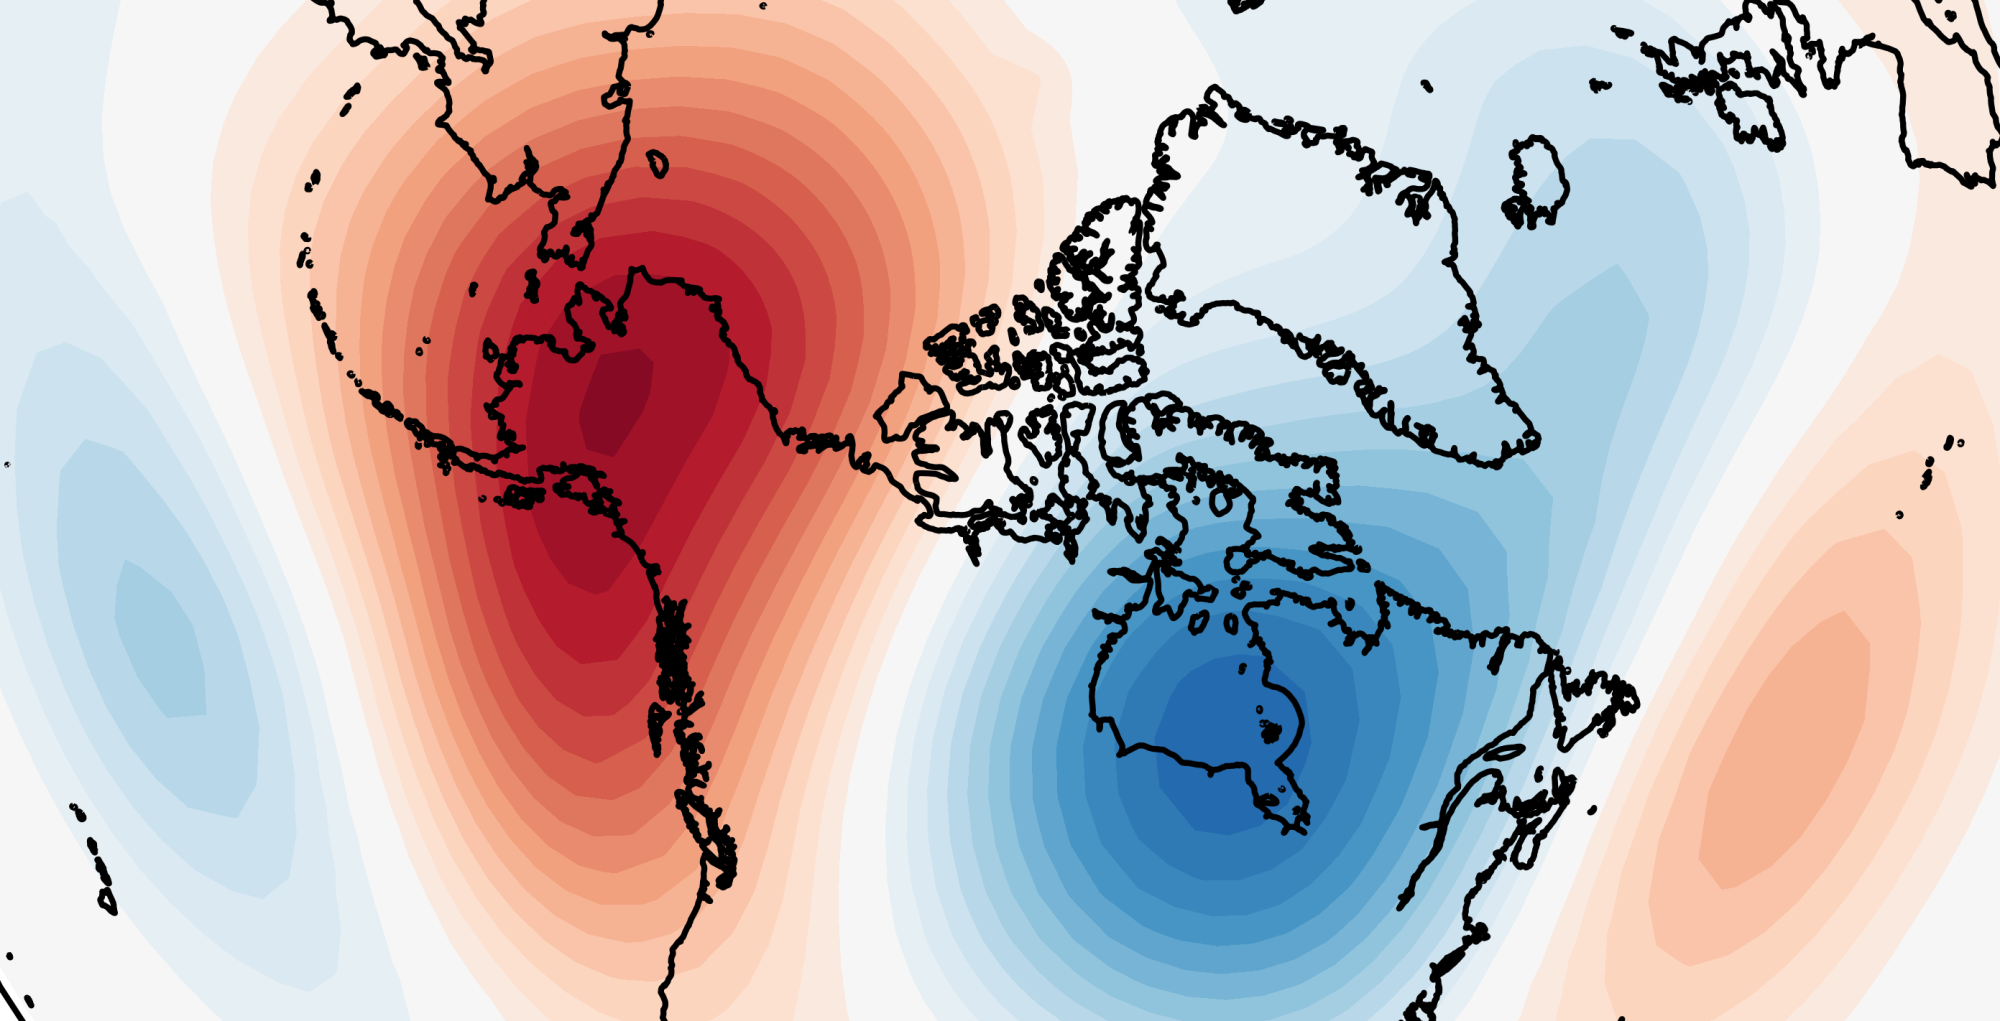
The CFSv2 initially trended strongly towards a -NAO for January 2019 as the SSW signal grew – but this has since decayed and transitioned more towards an Atlantic ridge pattern (Fig. 4). The model clearly picked up on a major SSW occurring – but, like all forecast systems this time, has struggled to predict the type of SSW. There is currently no indication (Fig. 5) from the CFSv2 forecasts of a widespread hemispheric cold outbreak (a “warm Arctic-cold continents” pattern).


My advice would be not to hold your breath for a “Beast from the East 2019 Edition”. But as predictability typically increases once a major SSW has occurred, we should gain a much better picture in the first few days of 2019.
Takeaway message: the impacts of SSWs are more complex than whether it is a displacement or a split, and the mere reversal of the 10 hPa 60N zonal wind doesn’t mean you’ll be shovelling snow 2 weeks later.
References
Baldwin, M. P., and T. Dunkerton, 2001: Stratospheric Harbingers of Anomalous Weather Regimes. Science, 294, 581-584, https://doi.org/10.1126/science.1063315.
Karpechko, A. Y., P. Hitchcock, D. H. W. Peters, and A. Schneidereit, 2017: Predictability of downward propagation of major sudden stratospheric warmings. Quart. J. Roy. Meteor. Soc., 143, 1459-1470, https://doi.org/10.1002/qj.3017.
Very interesting thanks.
You’re welcome, I’m glad you enjoyed it!
Thanks for a good informative article. Well structured, good use of references.
Keep up the good work
Cheers, you’re very welcome.
That CFS reference shows a below normal arctic for January… not sure what we are supposed to take from that other than the exact mirror image is a more likely outcome that its forecast. When was the last time a winter month was below normal in the arctic?
Interesting article Simon…a realistic and non-hyped view of SSWs, in a digestible format!
I did notice a few days ago that the synoptic pattern over Europe in early Jan 2013 when we saw a major SSW is very similar to what we have now and will have next week. Big ridge in W and NW of Europe. I recall also the models really struggling beyond 6-7 days to nail the European detail on the cold, that finally arrived in UK around 17th Jan!
Thanks Matt! Turned out to be far more popular than I envisaged! Interesting that the synoptic pattern is similar – I guess we shouldn’t be too surprised about that in terms of tropospheric precursors. I often think of a wet spell followed by mild weather as being a precursor but haven’t actually tested whether that is true…
Thank you for writing about this interesting paper (Kopechko et al., 2017). The 100-300 hPa zonal anomaly just aftr the day zero may be indeed an important precursor. By the way, I’ve learned from the paper about anther (Sigmond et al., 2013 in Nat. Geosci.) which claims only 20% SSW events end in meaningful (1.5 sigma in the whole atmosphere) negative zonal signal. Do you know that work? Any opinion?
Very interesting. The present SSW does not seem to have a negative zonal circulation anomaly in the 100-300 hPa zone. From the paper (Karpechko et al, 2017) it seems that means the chances are lower than 50% for a downward propagating event. Is that correct?